No one should imagine that this is a simple subject. Public data are unreliable, and comment is often ill-informed or biased. There are many arguments and counter arguments which need to be understood fully as the study evolves. There is important reading to be done, for which selected references at the end of the report may be a starting point.
That said, we will nevertheless try to reduce the subject to its bare essentials, using graphics to make the main points.
Some key background
- Origins
- Trends
The world has now been very thoroughly explored so that nearly all of the oil provinces have been found. Oilfields are clustered together in discrete trends where the remarkable and very exceptional geological conditions needed for generation and entrapment were met. They are separated by huge barren tracts that are barren for reasons that are well understood. For obvious reasons, the more prolific trends were found first, as were the larger fields within them. Most of what remains to be found will come from ever smaller fields in mature areas.
- Technology
Much of the world's oil was found long ago with fairly primitive technology. There have been considerable technological advances such as the semisubmersible rig that opened the offshore to routine drilling. Modern seismic surveys can map the oil zones with a very high resolution, and geochemistry can explain where and when the oil moved. These tools are sufficient to efficiently find and produce the world's endowment of conventional oil, as discussed below. Further technological advances can be expected and will be needed to find and develop ever smaller accumulations that have progressively less impact on world supply. This year's Buick is better than last year's model, but that was still good enough for most purposes. So there is no technological solution to the impending shortfall: it is not a technological problem.
-
Conventional and Non-conventional Oil
Much of the confusion about the world's endowment of oil stems from a failure to distinguish these two categories. Almost all the oil produced so far can be classed as conventional as will the bulk of what will be produced over the next twenty years or so. But when that supply dwindles, attention will turn to what may be termed non-conventional oil made up of:
- oil from tar sands and oil shales
- heavy oil
- enhanced recovery by changing the characteristics of the oil in the reservoir by steam injection or in other ways
- oil (if any) in very hostile environments - polar regions or very deep water
- oil from infill drilling to reach pockets bye-passed in the primary depletion of a field
- oil in accumulations too small to be viable exploration targets
The important distinction is that the unfettered production of conventional oil rises rapidly to a peak and then declines exponentially; whereas the production of non-conventional oil rises only slowly to a long low plateau, before in turn declining. The resources of heavy oil and tar sands are considerable, but the constraint to production is cost and the sheer scale of the undertaking. Non-conventional production is unlikely to make an impact until the tail end of conventional depletion and then only in a high or very high price environment. It is no substitute for conventional oil as has fueled the Twentieth Century economy.
- Recovery Factor
Petroleum is derived from organic material under conditions that were met only rarely in the Earth's long history and then only in a few places. Oil comes primarily from algal material, and gas comes from vegetal remains. Such organic debris settled to the floor of the lake or sea in which it lived, and in most cases was oxidized by bottom dwelling organisms or currents, but in certain stagnant environments has been preserved and buried beneath other sediments. On deeper burial, it was heated by the Earth's heat flow, and chemical reactions converted it into petroleum. Oil on very deep burial is cracked into gas. Once formed oil and gas migrate upwards through minute fractures and pores in the rocks, until they find a porous and permeable layer through which they can move. They then flow through this conduit until they are trapped in a fold, against a fault or where the conduit pinches out. Much is dissipated or held in the many constrictions encountered during its migration, so that only about one percent of what was formed is trapped in accumulations large enough to be exploited.
Oil occurs in the pore space of the reservoir rock where it is subject to capillary pressures. Production falls when the wells have to draw on oil farther and farther from the wellbore. Eventually a point is reached when no more can be produced. The percentage recoverable ranges from about 20 to 60% depending primarily on the gravity of the oil. Recovery factors depend on the amount of oil-in-place which is often not exactly known. It is often claimed that technology can improve recovery. In fact, the apparent improvements may reflect initial underestimate or understatement of the amount of oil-in-place rather than any technological breakthrough.
Data Bases
The following are the main sources of information:
- Petroconsultants in Geneva
- The Oil and Gas Journal
- World Oil
- BP
- US Geological Survey
This company maintains the most authoritative database on production and reserves as well as important drilling statistics for the world outside the United States and Canada, but it is available only on subscription. It also publishes reports on future supply and depletion built on its database and unrivaled knowledge. It is extensively used by the oil companies who contribute their knowledge to it. Access is however costly reflecting the large investments involved, which puts it out of range for most individuals or scholars.
This journal has published for many years reserves and production by country normally in one of the last issues of the year. It is one of the most widely used sources of information, and particularly useful because of the long history of consistent reporting. As a trade journal it cannot however interpret the validity of the data provided to it.
This journal likewise has published similar data over the years, usually in an August issue. In many cases, its numbers are the same as those in the Oil and Gas Journal, although there are also significant differences.
This major oil company publishes the same type of data in its annual Statistical Review of World Energy, but the reserve data are simply reproduced from the Oil and Gas Journal and do not reflect the company's own assessment.
This government department publishes useful data at three year intervals at World Petroleum Congresses, but it is important to understand that it has its own reserve definitions that need to be decoded before the material can be used profitably.
Elements
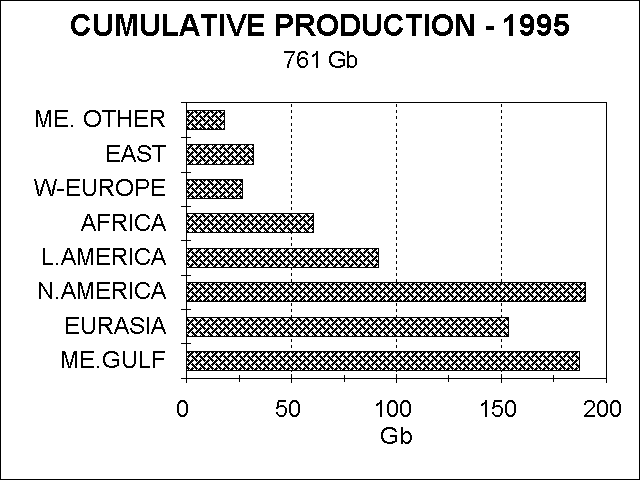
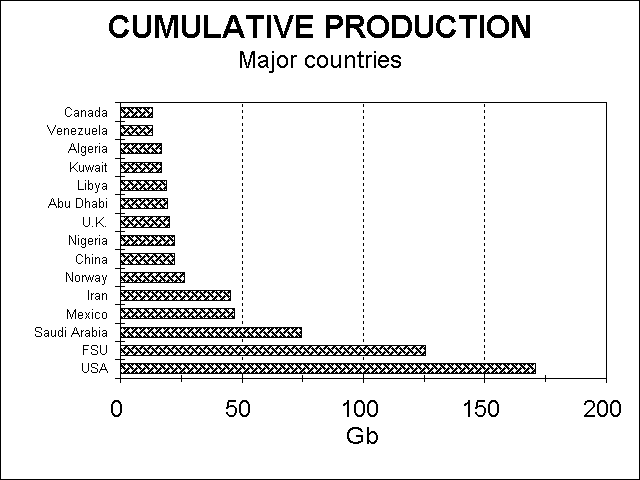
Certain key elements have to be taken into account in estimating the world's endowment of conventional oil. The references should be consulted for a discussion on how these elements are defined, which is particularly important in connection with reserves. Here, it will be sufficient to illustrate them graphically, considering the world's regions and the fifteen most amply endowed countries. The numbers are taken from Campbell (1996), except were indicated otherwise and are quoted in billion barrels (Gb). In all cases they refer to conventional oil only as of the end of 1995. Although quoted as exact numbers as computed, they should of course be generously rounded. The regions for this purpose are defined as follows:
- Middle East (Other): Turkey to Oman and Yemen outside M.E.(Gulf)
- East: Pakistan to Viet Nam and Australasia
- W.Europe: Norway to Italy
- Africa
- Latin America: South America and Mexico
- North America: USA and Canada
- Eurasia: FSU, China and Eastern Europe
- Middle East (Gulf): Abu Dhabi, Iran, Iraq, Kuwait, Neutral Zone, Saudi Arabia
- Other: countries with <500 Mb Ultimate or not in production; and unforeseen discovery and revisions anywhere.
 |
| Figure 1 |
 |
| Figure 2 |
Produced-to-date (761 Gb)
The concept of Produced-to-date or cumulative Production is straightforward
- how much has been produced. It is however necessary to watch out for
territorial changes and the treatment of war loss, as in Kuwait (2.5 Gb),
which in principle should be regarded as production, although in this case
is ignored as being small in relation to the uncertainty of the reserves.
North America and the Middle East Gulf have produced the most, at just
under 190 Gb, with Eurasia in third place. In terms of individual countries,
the United States heads the list (171 Gb), followed by the FSU (125 Gb)
and, far behind in third place, Saudi Arabia with 74 Gb. This illustrates
the maturity of the United States, which for many years in the past was
the world's most important producer.
 |
| Figure 3 |
 |
| Figure 4 |
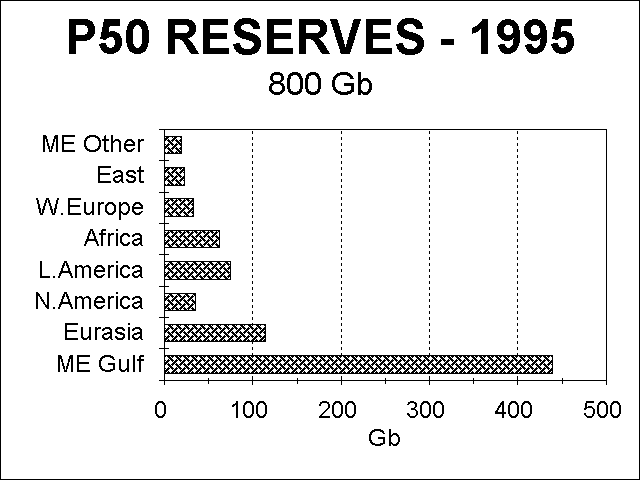
Reserves (800 Gb)
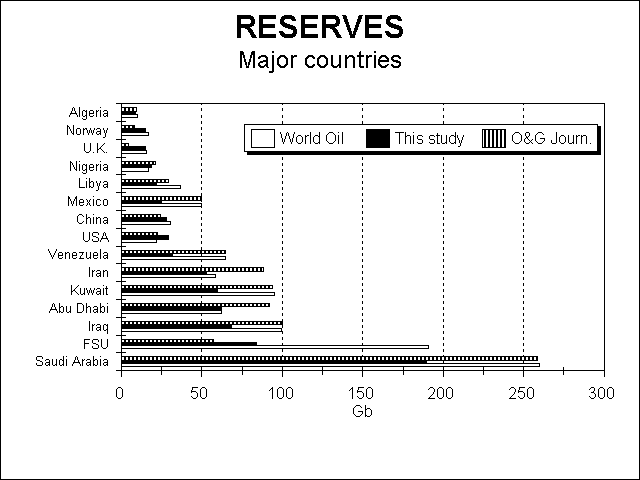
The term Reserves means the amounts yet to produce from known discoveries as of the reference date, but the numbers are confused by differing definitions and other distortions (see references). Many published numbers are unreliable. Here, we refer to what are termed "Median Probability Reserves (or P50 Reserves)", which means that the risks that the actual number will turn out higher or lower than the estimate are equally matched. Most published reserves are described as Proved, but are often far from that.
The Middle East (Gulf) has more than half the world's reserves with
439 Gb, followed far behind by Eurasia with 114 Gb, and trailed by Latin
America (74 Gb). In terms of individual countries, Saudi Arabia heads the
list with 189 Gb, followed by the FSU with 84 Gb. Several other countries
with comparable amounts come next in line : Iraq (68 Gb); Abu Dhabi (62
Gb); Kuwait (60 Gb) and Iran (53 Gb). Figure 4 illustrates the wide range
in the published estimates.
 |
| Figure 5 |
 |
| Figure 6 |
 |
| Figure 7 |
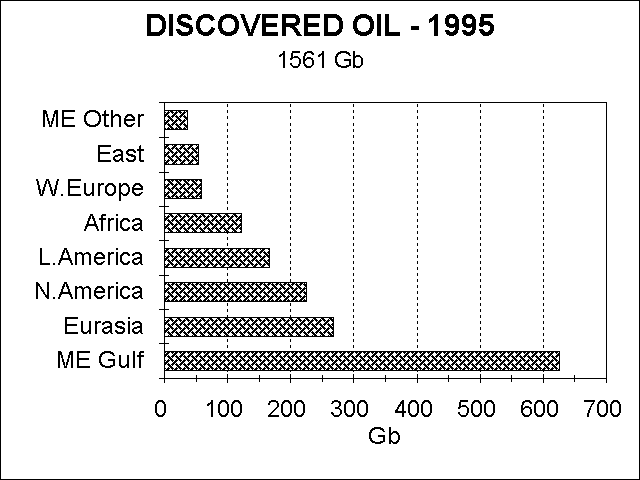
Discovered-to-date (1561 Gb)
The Discovered-to-date is the sum of the Cumulative Production and the Reserves.
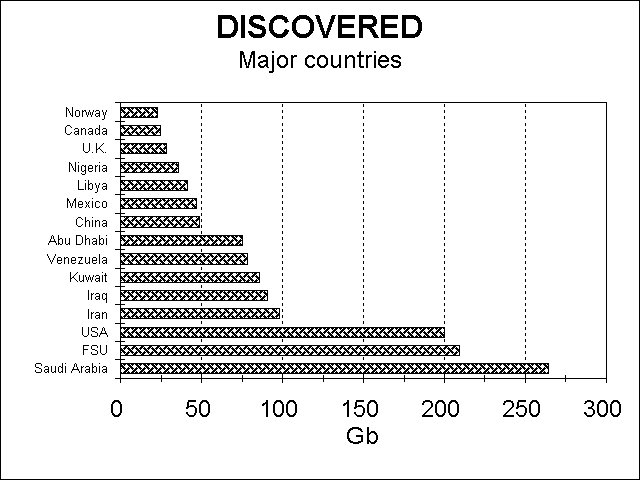
The Middle East Gulf is in first place with 626 Gb, followed by Eurasia (267 Gb) and North America (225 Gb). In terms of individual countries, Saudi Arabia is again at the head of the list with 264 Gb, followed by the FSU (209 Gb) and USA (200 Gb).
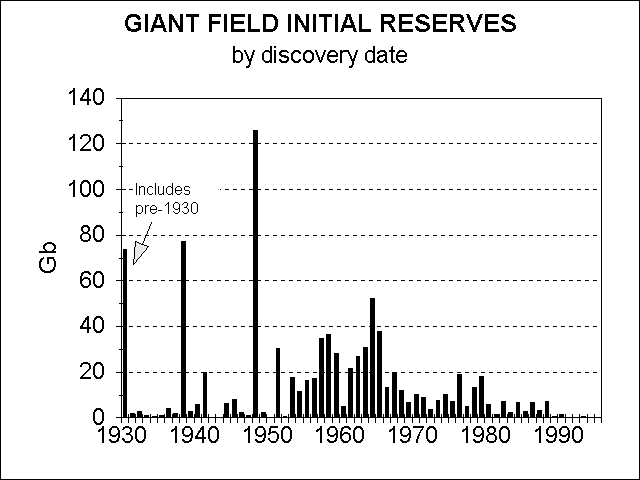
About 63% occurs in just over 300 giant fields, namely those with more than 500 Mb of ultimate recovery. The discovery of giants fields peaked in the 1960s as shown in Figure 7. This is a very critical statistic with serious implications for the future. The discovery of giant fields has fallen dramatically in recent years and few, if any, remain to be found. Most giant fields are found early in the exploration process, being too large to miss. Most were found without the benefit of advanced technology.
 |
| Figure 8 |
 |
| Figure 9 |
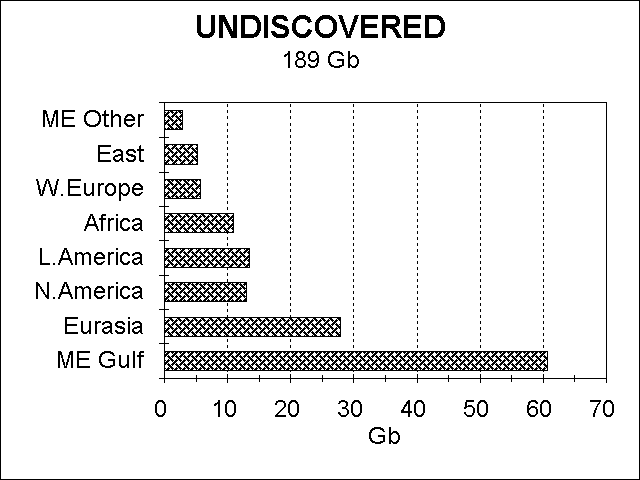
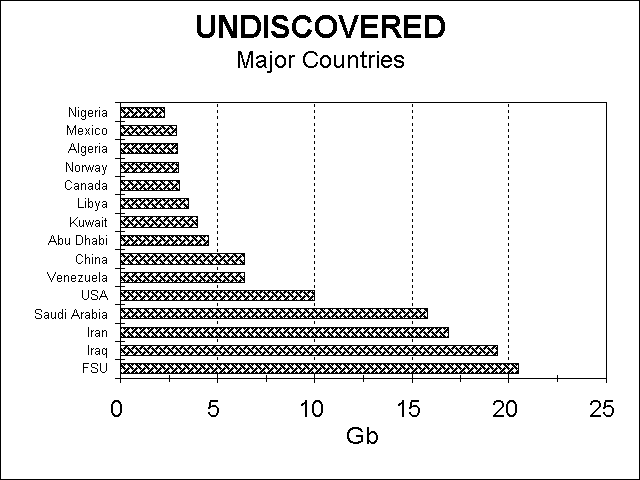
Undiscovered (189 Gb)
The Undiscovered, or Yet-to-find, is the Ultimate (see below) less the Discovered. The Middle East (Gulf) has the greatest potential with 61 Gb, followed by Eurasia with 28 Gb. North and Latin America with respectively 13 Gb and 13.5 Gb are in near equal third place. In addition, some 50 Gb is attributed to unforeseen discoveries or reserve revisions anywhere. In terms of individual countries, the FSU (21 Gb), Iraq (19 Gb), Iran (17 Gb) and Saudi Arabia (16 Gb) seem to have the greatest promise. Discovery rates are falling, currently standing at about 7 Gb a year. Drilling rates and the amount discovered per well are also falling. There may be some improvement in success ratio as exploration turns to lower risk mature areas, but the amounts found are expected to continue to decline. Most of what remains will likely be found within 10-20 years in most countries outside the Middle East Gulf and the FSU where exploration may continue to be a low priority for some years to come.
 |
| Figure 10 |
 |
| Figure 11 |
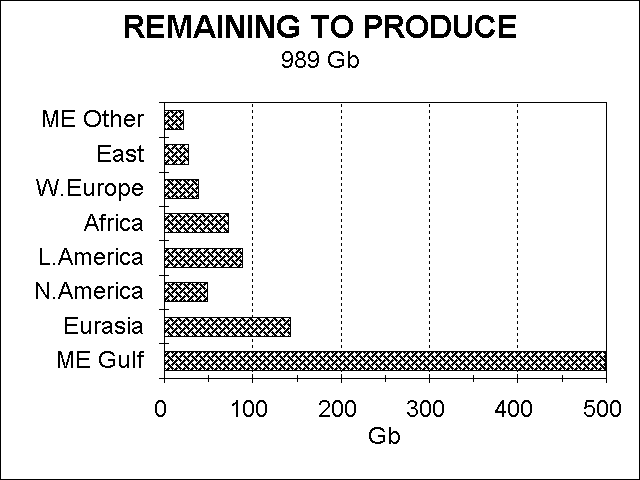
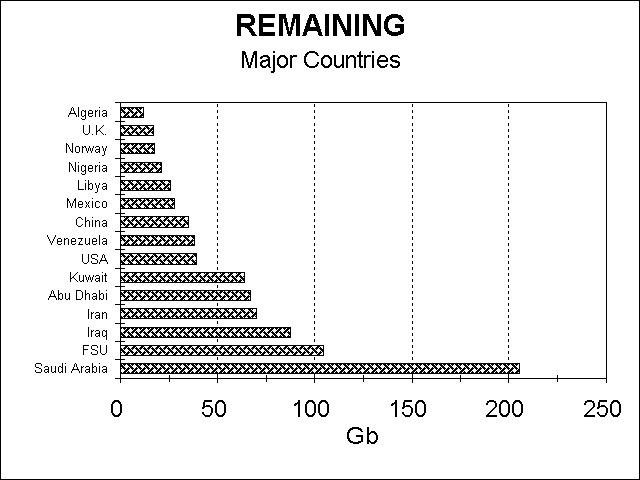
Remaining (989 Gb)
The Remaining is the Ultimate less the Produced, or in other terms the Reserves plus the Undiscovered. It is the bottom line, namely how much is left to produce, and is the statistic we need to run the depletion model. The region with the most is of course the Middle East Gulf with 499 Gb, which is about half the total. It is followed by Eurasia with 142 Gb and then Latin America with 88 Gb. By individual country, Saudi Arabia comes first with 206 Gb, followed by the FSU (105 Gb) and Iraq (88 Gb). So far as the western world is concerned, the two leading countries are the USA with 39 Gb and Venezuela with 38 Gb. It is evident that about 70% of the world's remaining oil lies in countries that are not really part of the open market and in which the oil industry is exclusively in state hands.
 |
| Figure 12 |
 |
| Figure 13 |
 |
| Figure 14 |
 |
| Figure 15 |
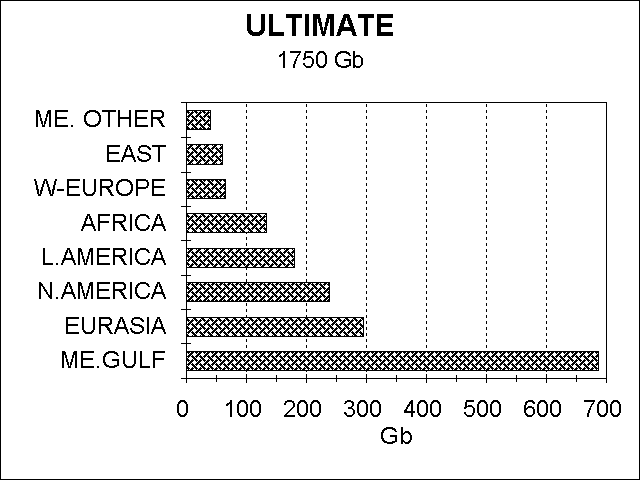
Ultimate (1750 Gb)
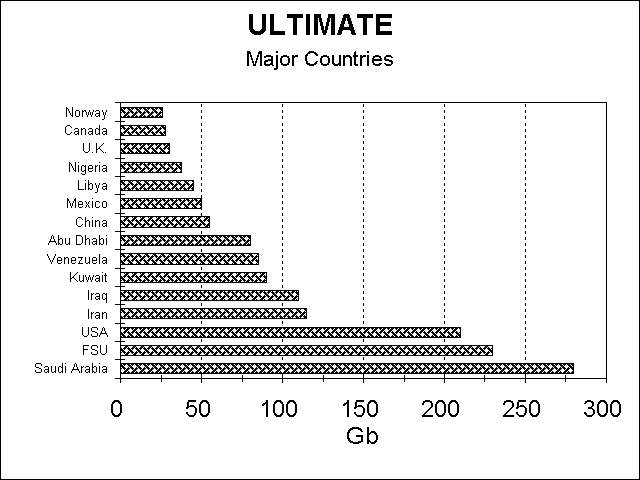
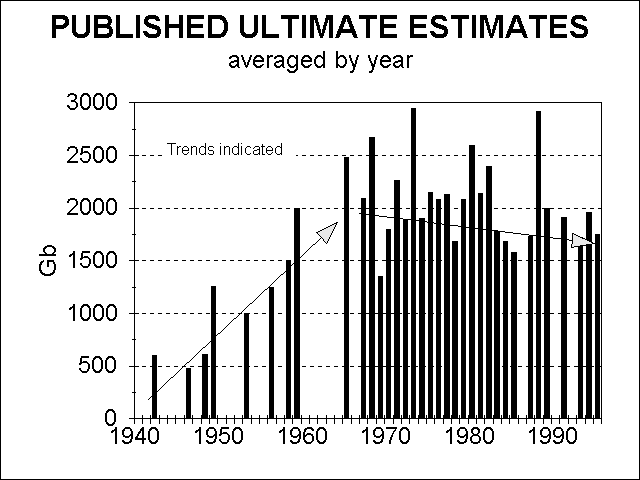
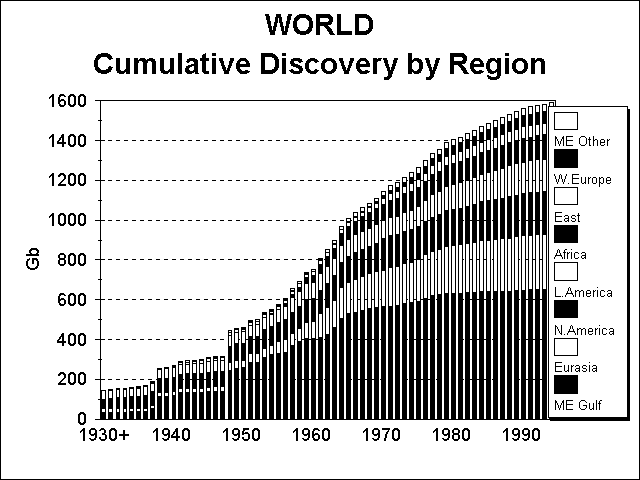
The Ultimate is Cumulative Production when production ends. It is very important to recognize that there is an ultimate, even if the number cannot be determined exactly. The number proposed here is a rounded 1750 Gb which can be used to drive the depletion model for the next ten or twenty years through peak production into decline. It refers, like all the other numbers to conventional oil only. It may well be due for some upward revision in the far future in a high or very high price environment when some of what is here treated as non-conventional becomes conventional. The 1750 Gb is in fact approximately the same as the 2300 Gb proposed by the US Geological Survey, if that is redefined to take into account only Median Probability Reserves and the low end of the range of Undiscovered which is all that meets relevant time and economic constraints. It also is suggested by the trend of published estimates. Those desiring a higher number often show the same plot but take the scatter rather than the trend. Here weight is given to the trend because the more recent estimates have the advantage of modern technology and a colossal database from worldwide drilling. Care must however be taken in checking the definitions applied. Some of the higher reported numbers include what is here treated as non-conventional oil. Another very compelling argument comes from the plot given in Figure 15, showing discovery with reserve revision backdated to the discovery date. It shows a marked inflection to falling discovery in the 1960s. Extrapolating the subsequent curve gives a very clear intimation of future discovery and hence the Ultimate. If indeed the reserve estimates of particularly the Middle East prove to be higher than here assessed, it would mean that the inflection would be even more pronounced, reducing further the recent trend. It is accordingly difficult to argue convincingly for an Ultimate much higher than that proposed, given especially the fact that virtually the entire world has been explored sufficiently to indicate the existence of the major provinces. Only a new province with a crop of giant fields could have any global impact.
The Middle East Gulf Region has the largest endowment with 687 Gb, followed by Eurasia with 295 Gb and North America with 238 Gb. Saudi Arabia (280 Gb), the FSU (230 Gb) and the United States (210 Gb) are the three most richly endowed countries
Depletion Model
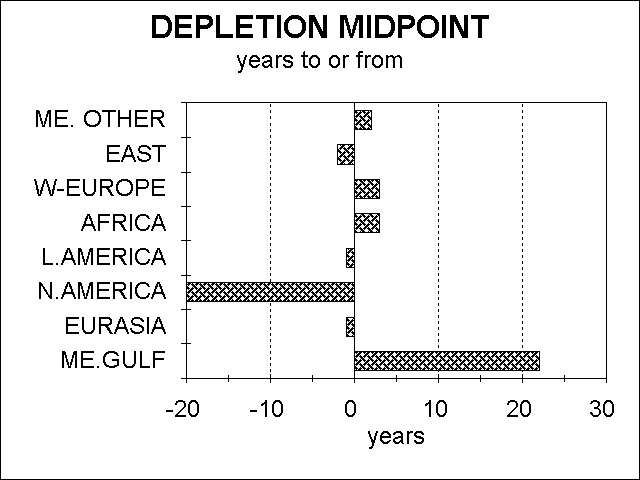
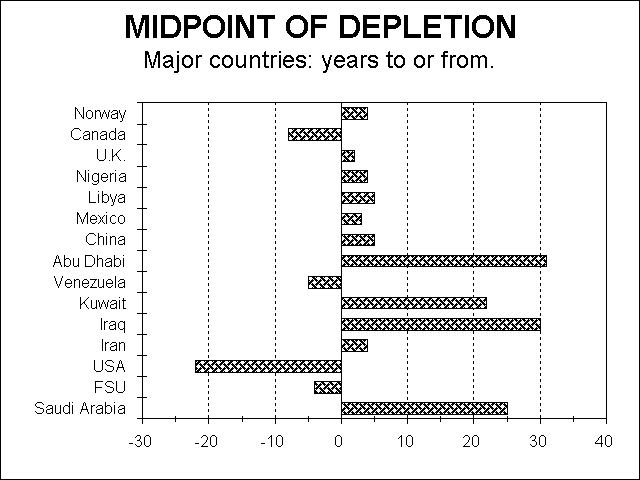
We have now developed an assessment of how much conventional oil there is and how much remains to produce, the Remaining. Oil does not occur in some vast underground cavern from which is could be quickly pumped, but it is held in the minute pore space of the reservoir rocks, in the same way as rising damp can flow through the walls of old stone buildings. It is easy to understand therefore why wells begin to decline as they have to draw on oil farther and farther from the wellbore. The production of an oilfield rises rapidly as new wells are added but then when all the wells are in place declines exponentially at a composite depletion rate. Depletion Rate is a given year's production as a percentage of the remaining reserves at the end of the preceding year. So it is with a geological basin: production rises as new fields are found, and it is normal for the larger ones to be found first. Their depletion rate tends to mask the effects of small late stage additions. Lastly, it is the same for a country, with the larger basins usually being developed first. The natural pattern can of course be modified if production is deliberately held to a certain limit. Thus production of an offshore field may be held at a plateau constrained by the number of wells and the optimal off-take in relation to investments. Likewise, a country may arbitrarily manipulate production to maintain price in a practice known as prorationing, as practiced for example by the Texas Railroad Commission, and less successfully by OPEC with its quotas. In any event, the production of any field starts at zero, rises to a peak (or plateau if artificially constrained) and then falls to zero. The profile of individual fields is normally asymmetrical, being skewed to the left, but a country's peak tends to be symmetrical because it is made up of a progression of individual field profiles. It follows then that peak production will more or less coincide with the midpoint of depletion, except where there are artificial constraints, and even then the midpoint of depletion will roughly coincide with the midpoint of the constrained period. Depletion rate rises during the early production of a field (or country's production) as new wells or fields are added, but tends to stabilize at the midpoint, such that production declines exponentially thereafter, ultimately due to the immutable physics of the reservoir. The midpoint of depletion comes when half the Ultimate has been produced. Since we have now estimated the Ultimate for each country, we are in a position to estimate when peak production will come and plot the subsequent decline. It means that we can divide the world's producing countries into three categories
 |
| Figure 16 |
 |
| Figure 17 |
- Post-Midpoint Countries
- Pre-Midpoint Countries
- Swing Producers
Production is declining exponentially in these countries. Strictly speaking it would be best to plot the depletion from midpoint at the midpoint depletion rate, and treat any departures from this notional curve as anomalies that eventually even out, because more production early has to be matched by less production later, given the fixed Ultimate. But in practice one can as well take the current depletion rate to keep it simple, because in most cases the current rate differs only slightly from the midpoint rate. Doing so also makes the short term prognosis a little more realistic.
A few countries, save those in the Middle East Gulf region, are still a year or two away from midpoint. If actual near term production forecasts are known, they can be fed in, but otherwise it will suffice to apply an arbitrary increase of, say, 5%, because it applies only for a few years. Once they reach midpoint, they decline exponentially at the midpoint depletion rate.
As outlined above, about half the Remaining lies in the five countries of the Middle East (Gulf) Region, which are at a very early stage of their depletion. These countries are therefore natural candidates to perform a swing role, making up the difference between world demand under alternative scenarios and what the other countries can produce under the model. It is role that they can perform for about 15 years until they themselves also reach their midpoint. It would also be an option to include certain other countries, such as Venezuela or Mexico, in the swing category, but on balance it seems better to restrict the swing role to the Middle East Gulf.
 |
| Figure 18 |
 |
| Figure 19 |
Future Scenarios
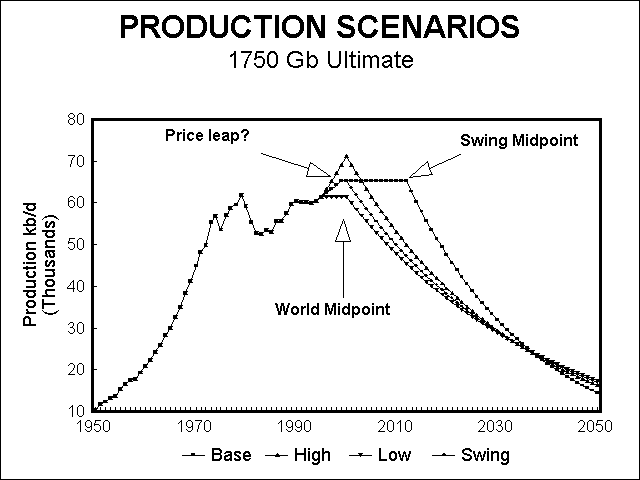
Many different scenarios could be considered, but for illustrative purposes we are content with four, see Figure 18.
- High Case
- Low Case
- Base Case
- Swing Case
Demand increases at 3% a year until production reaches the world midpoint, when resource constraints cause it to decline at the then depletion rate
Demand is flat, and production stays level until the world midpoint, when it declines.
Demand rises at 1.5% a year until production reaches the world midpoint when it declines.
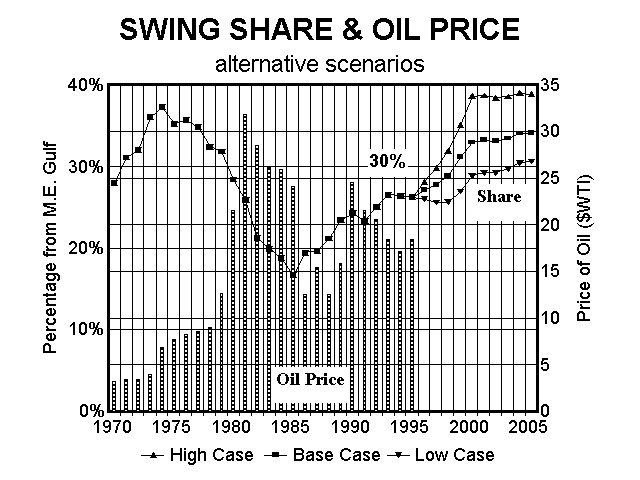
As the Base Case, save that price rises, when the swing share exceeds 30%, curb further demand increases, leading to a production plateau that lasts, not until the world midpoint, but until the swing producers reach their midpoint.
It happens that in the Base Case, the swing share rises to 30% only a year before the world midpoint. It points to a radical rise in price, due to the increasing control of the market exercised by these countries. The share under the Swing Case rises to almost 60% by the time the swing producers are forced into decline.
Political Factors
This model is built on resource criteria, which show that a few Middle East countries will have a critical control of the world supply within a few years. Exactly what constitutes effective control is hard to say, but the threshold for the last oil shocks was 30%, which seems a reasonable approximation. How these countries elect to use their control and what political pressures are brought to bear cannot of course be predicted from resource considerations.
Some key elements can however be identified
- The pivotal role of Iraq
- Financing the Swing Share
- Short term exports from Norway and the FSU
- Instability, market and limited capacity
No one quite knows the origins of the Gulf War, although some hints are given by Schweizer in his book Victory. The net consequence, however, has been the removal of 2- 3 Mb/d from the market under the embargo, which OPEC failed to achieve by its quota system. This has been sufficient to maintain oil prices at a moderate level, which in turn has contributed to the survival of the Saudi, Iranian and a few other regimes that depend heavily on oil revenues. The embargo can also be relaxed if prices rise in a manner unacceptable to those enforcing the embargo. In effect, it makes Iraq the swing producer of last recourse. It is however a function that can be applied for only a few years, as Iraq's oil will be needed in full from about 2000 to meet the requirements of the demand scenarios.
Doubts have been expressed as to the willingness of the swing countries to invest in adding the capacity needed for them to discharge their swing role, given that the oil industry is almost exclusively in State hands and given that the State has many other demands on its precious oil revenues. While prices are low, they are ironically forced to produce to the maximum to meet their pressing demands for revenue, but once prices rise they will have greater room to maneuver. The investment could be forthcoming if they were willing to open their doors wide to the international oil companies, but that may be unacceptable in political terms, especially if rising prices reduce the need.
Norway, which has about half the North Sea's remaining oil, exports a large proportion of its production because of its small population. Production will peak in 1999 under the model and then decline at a high depletion rate of about 8%, as is typical of offshore production. FSU exports have also been relatively strong because falling production has been exceeded by falling domestic demand. Any economic improvement there could radically change this situation. Both of these factors may serve to greatly increase the Swing control by about 2000.
The price of oil is today set by a very efficient forward market that is more a reflection of present trends than speculation or judgment about the future. There is today very little immediately available spare capacity anywhere. It follows that relatively minor interruptions in supply, or even threats of same, in any one of a number of countries subject to political or industrial strife can have a radical impact on the price of oil. Once prices rise for what ever short term reason, the trend may feed on itself as the suppliers have greater ability to curb production without crippling their revenue stream.. There are currently question marks about the nature of the Saudi succession as well as Iranian intentions in arming islands in the Gulf of Hormuz. A spark once kindled could easy lead to a bush fire.
Conclusions
Predicting the future is a dubious undertaking. The oil database in the public domain is weak, and there are many uncertainties. That said, compelling evidence points to a pending oil supply shortfall, possibly before 2000, which could trigger a third and permanent radical rise in oil prices. There is a certain skepticism because people have cried wolf before, but this time the situation is totally different from that which allowed the oil shocks of the 1970s. Then, the swing control was being undermined by flush production coming on stream from new provinces in the North Sea, Alaska and elsewhere that had already been found. This time none are even in sight and very possibly do not exist. We face a different world. The basic situation is clear, although there is plenty of room for debate about the size of the numbers and depletion scenarios. Those who investigate sensitivities will soon find that there is not in fact much room for radically different interpretations. Every effort should be made to improve knowledge of what has been found so far to secure a better basis for projecting future discovery and production. It is not so much a technical issue as a political one to open the files and see what is really in them.